
Quantifying great UX
Here’s how you measure / quantify a great user experience (UX) which is a precursor to building great products?


When one talks of great products one is usually referring to great user experiences (UX) & it is just that the former is a trivial way of saying it when the latter is a more technical / sophisticated way of saying it.
Corollary:
Great UX is a precursor to building a great product
But what are the means to define a great UX?
Well. Ever heard of the 3-30-3 rule ⁉️
I must confess, I hadn’t come across this term until I had the opportunity to brush shoulders with my design team up close over the recent past.
Although there was something on similar lines that came into being in the early 2000s when website building took center stage (DOTCOM era), it loosely defines the success criteria for a website based on the time the users tend to spend once they land there. As of today, one could easily extend that logic to Web Apps & Mobile Apps just as much.
The rule suggests that the App ought to strike a quick impression underlining how the visitors may have just a few seconds to connect with the product in particular & the page in general.
STEP 1: First 3
Supposing you have a visitor on the landing page & you happen to retain them there for 3 seconds you may have grabbed their attention successfully
STEP 2: Next 30
If they happen to cling on there for the next 30 seconds they may be interested in your product or service
STEP 3: Final 3
And if they spend the next 3 minutes on your site you may have them in the bag which means the chances of conversion is pretty bright
But here’s a question.
Is that really enough when we are set out to define / quantify great UX?
I guess one ought to start by questioning what can one really get done in 30 seconds. May be one could see a few visuals, read the headings & scope the layout, scroll around & engage with a few sections with a few clicks there.
But does that constitute the whole UX?
No, that’s just the UI part of it. Is it not?
Although those elements largely qualify as UI which obviously & inherently do form an integral part of the UX, “They Just Don’t Suffice” especially when one is referring to the parlance of UX as a whole.
Given how “you can’t improve what you can’t measure” how does one measure great UX or even begin to quantify it?
Start by taking a closer look at the journeys of your users right from the time they discover your product & onboard themselves all throughout the time they spend with it. You’d notice how a few crucial patterns could be derived over their product’s usage & that could be pretty straightforward to quantify whether or not the UX is great.
It could be broadly classified under:
Here are some important metrics you ought to be measuring, tracking & targeting towards the improvement of your UX, iteration by iteration, cohort after cohort.
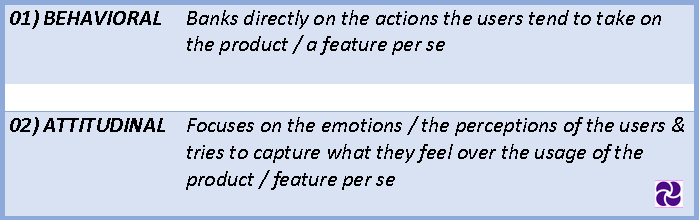
BEHAVIORAL METRICS
1. TIME ON TASK:
(Measures the amount of time slices users take over a given task)
A task could be anything from filling out a small dialog box with a few fields in there & clicking on the SUBMIT button or could involve something complex like initiating the data capture activity from an IoT device & plotting them values over a LIVE graph running continuously so as to help monitor it, actively listening for a certain kind of a signal, capture that to mark a culmination & then commit it finally by clicking on the SUBMIT button.
[Formula: No. of seconds users take to finish a task]
2. TASK SUCCESS RATE:
(Measures the overall success rate of the product / feature amongst the user groups)
This is a relative metric that analyzes USABILITY / EASE OF USE across the entire sample space of users who are currently actively using the product / feature. The ease with which the users get to their outcomes serves as a crucial metric to understand whether the product / feature as a whole resonates with the users.
[Formula: No. of users who finish a task / Total no. of active users * 100]
3. AVG. SESSION TIME:
(Measures the duration of a user session)
This is another one of those relative metrics that analyzes USABILITY / EASE OF USE across the entire sample space of users who are currently actively using the product / feature. The amount of time the users take on an average could be of some significance given how one may not be willing to stay on if one isn’t really finding any value. But, when combined with other metrics like the [Task Success Rate], [Error Rate], [Time on Task] & the [DAU, WAU] this would prove to be more solid an indicator of the user reaping the benefit / perceiving the value in the product.
[Formula: Total duration of all sessions of an user / Total no. of sessions * 100]
4. ERROR RATE:
(Measures the no. of mistakes a user makes over a session)
This is another important relative metric that analyzes USABILITY / EASE OF USE. If the data depicting the user’s trail shows that they are being faced up with errors over the usage of the product / feature it could simply point to friction at the UI level or something much deeper at the Design / UX level hindering them from reaching their outcomes over those sessions.
[Formula: No. of errors / No. of sessions * 100]
ATTITUDINAL METRICS
1. XAU [DAU / WAU / MAU as relevant]
(Measures the no. of users who are actively using the product)
Although lagging, this is a simple & yet a strong indicator of the confidence levels the users feel around a product / a feature. The number of active users plotted across cohorts is a simple way to visualize the direction of the trendlines which could be either of:
flat (as in healthy but not growing)
dipping (unhealthy, losing users)
rising (healthy, the angle of inclination indicating the magnitude of health)
[Formula: No. of active users across a DAY / WEEK / MONTH]
2. RETENTION RATE:
(Measures the no. of users who stick around over a period)
Another lagging yet powerful indicator measuring the stickiness of a product over a given period of time. Usually measured across cohorts / cadences it points to the number of users who have decided to cling on to the product which could simply mean that they have realized the value.
[Formula: (Active users at the end of a period – New users during the period) / Users at the beginning of the period * 100]
3. USABILITY RATE:
(Measures the ease of use / usability of a given feature)
Post launching a new feature which could simply signify a major / minor change (new feature addition is also billed as a change) to the existing workflow it simply makes sense to gauge the usability, the ease with which the users were able to find themselves around. Although one may argue that the behavioral metrics could suffice if one wants to arrive at this metric, floating something like a micro-survey & giving enough room for feedback (VERBATIM – written feedback, paragraph type option) could augur well for both the users given how they could feel like they have an ear they could talk into & not to mention the org. / product teams given how they could have access to some highly specific feedback that may not have been straightforward to capture.
NOTE: Special mention for the timing of floating the micro-survey, it should obviously succeed a new feature release but it ought to be done within a timeframe so as to maintain relevance. And also, another word of caution against overusing it over every feature release. Use it wisely.
[Formula: Usability survey / micro-survey floated with just 1 question like “The feature was really easy to understand & I could easily find my way around it” with a Likert scale options which do help zero-in on specific feedback over the ease of understanding & use of the latest feature release]
Conclusion:
When there are these indicators that have been proven to yield the right results as for the usage (I can vouch for that myself over the course of my experiences & the products / features we have released as a team) please feel free to brainstorm with your customer success teams if you want to go for something like a hybrid-metric which is to say a metric derived from a combination of existing metrics / some other specific event (like say a specific CTR) / any other keystroke towards helping you precisely zero-in on & quantify / measure the success.